Motion Graphs
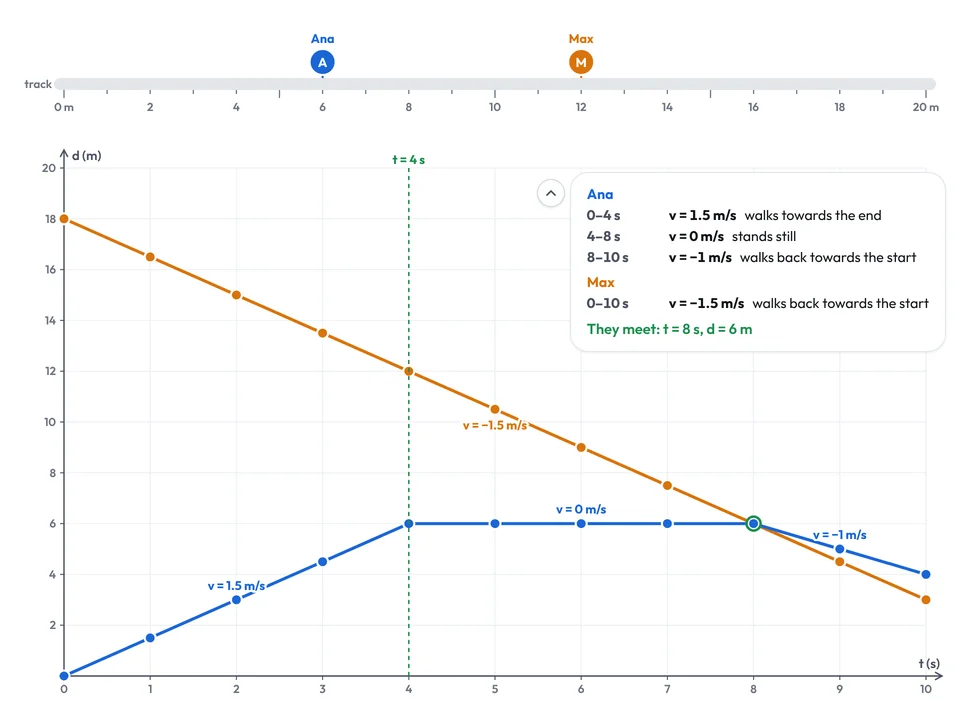
Distance-time graphs live: walkers move along a track as the graph is drawn, and the slope is the velocity. Turn stories into graphs or walk a given graph.
Free, runs in the browser, no sign-in or installation.
- Subject
- Mathematics
- Area
- Algebra and Functions
- Level
- Primary and secondary school
What you can do
- Drag the points of the graph and press play: the walker moves along a 20 m track, and each part of the graph shows its velocity.
- Add a second walker to see when and where the two meet, and show the velocity graph below the distance-time graph.
- In Story → graph, students read a story, build the graph and check it; points in the wrong place are shown in red.
- In Walk the graph, drag the walker along the track as time runs to follow the dashed graph; the app then shows your average distance from it.
- Download the graph as a PNG with a white or transparent background; set the animation speed and the grid under Display.
Pictures in the Gallery2
Ready-made pictures made in this app, to download as PNG.
Worksheets and lessons
Lessons with worksheets that use this app.
More apps: Algebra and Functions
Growing PatternsGrowing patterns: from a picture to an expression in n.
Balance ScalesLinear equations and inequalities on balance scales: the same to both sides, step by step.
Algebra TilesExpressions and equations with tiles, multiplying and factorising.
Binomial CubeA cube taken apart: the cube of a binomial, sums and differences of cubes.
PowersFrom 1 to 2⁻³: a staircase of powers, the rules for powers and scientific notation.
Line ExplorerLinear functions: steepness of ramps, slope as rise over run, the line through two points and forms of the equation of a line.